DISTRICT OF COLUMBIA
DISTRICT OF COLUMBIA LOCAL TAXES
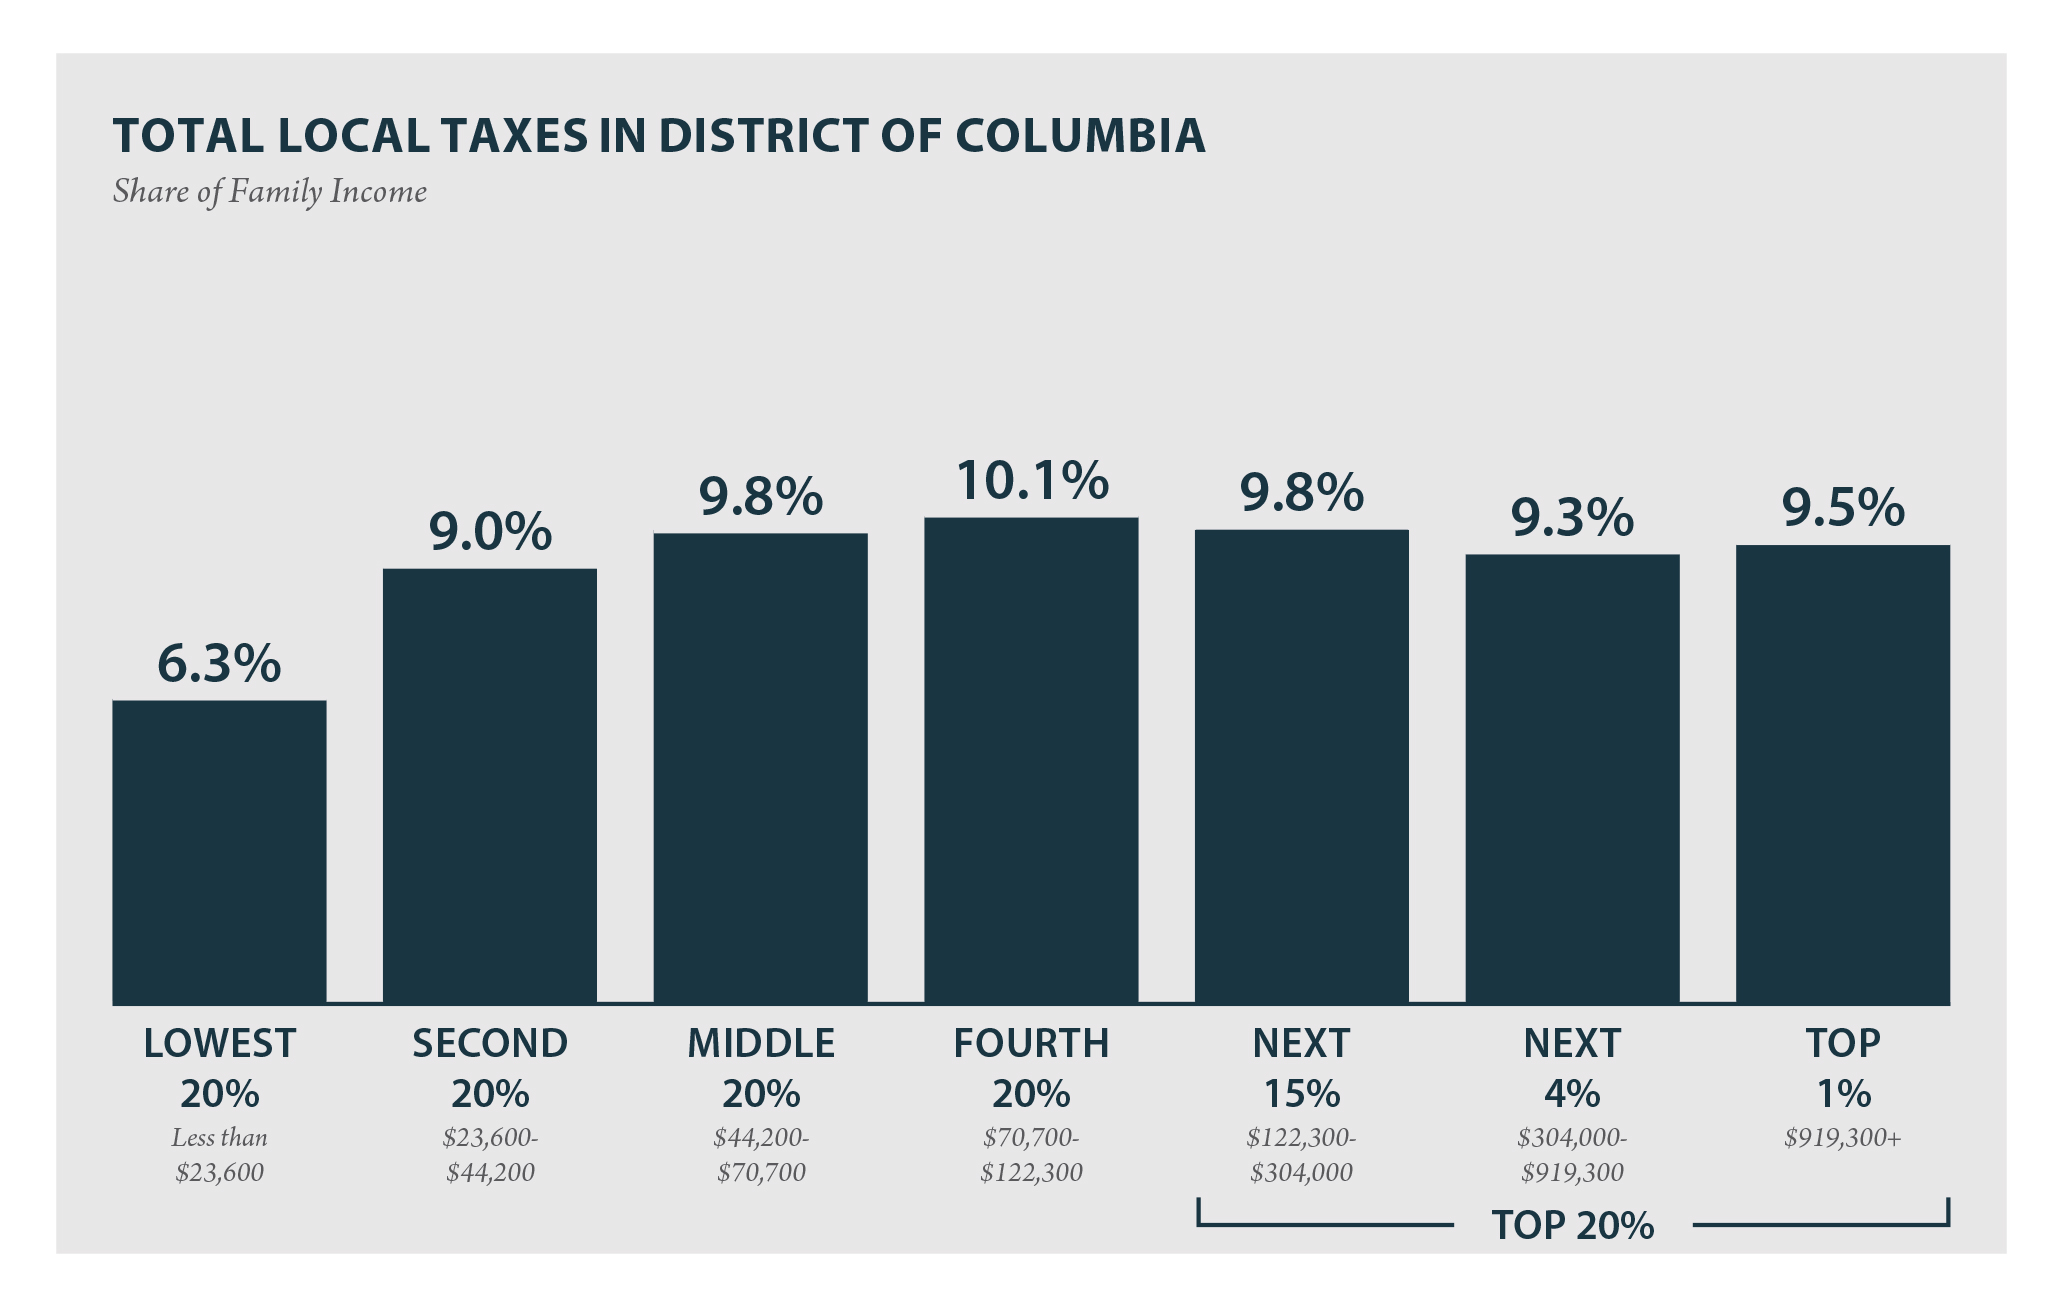
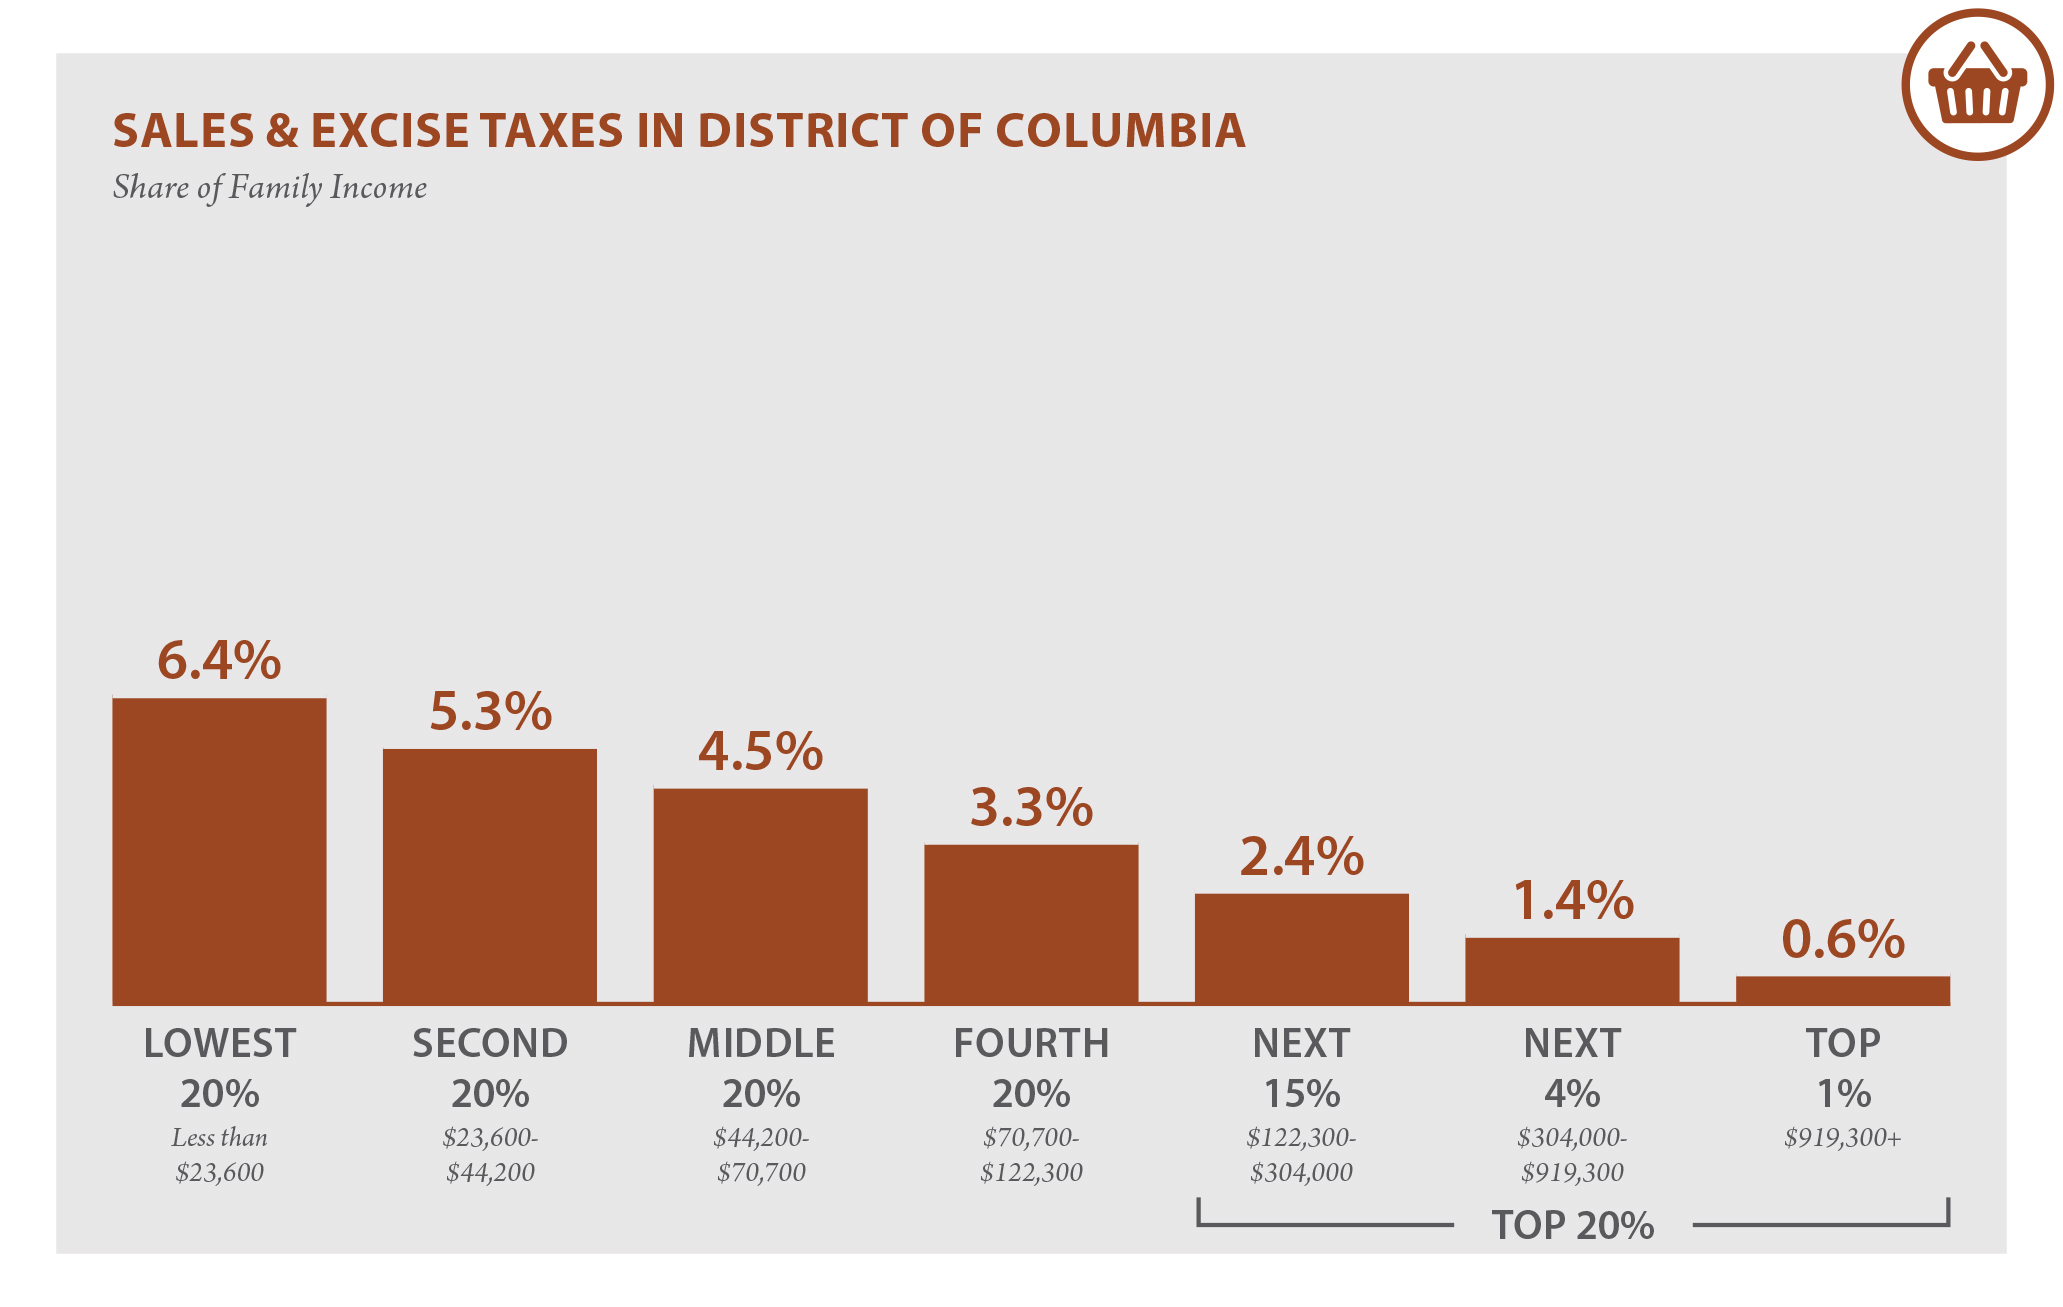
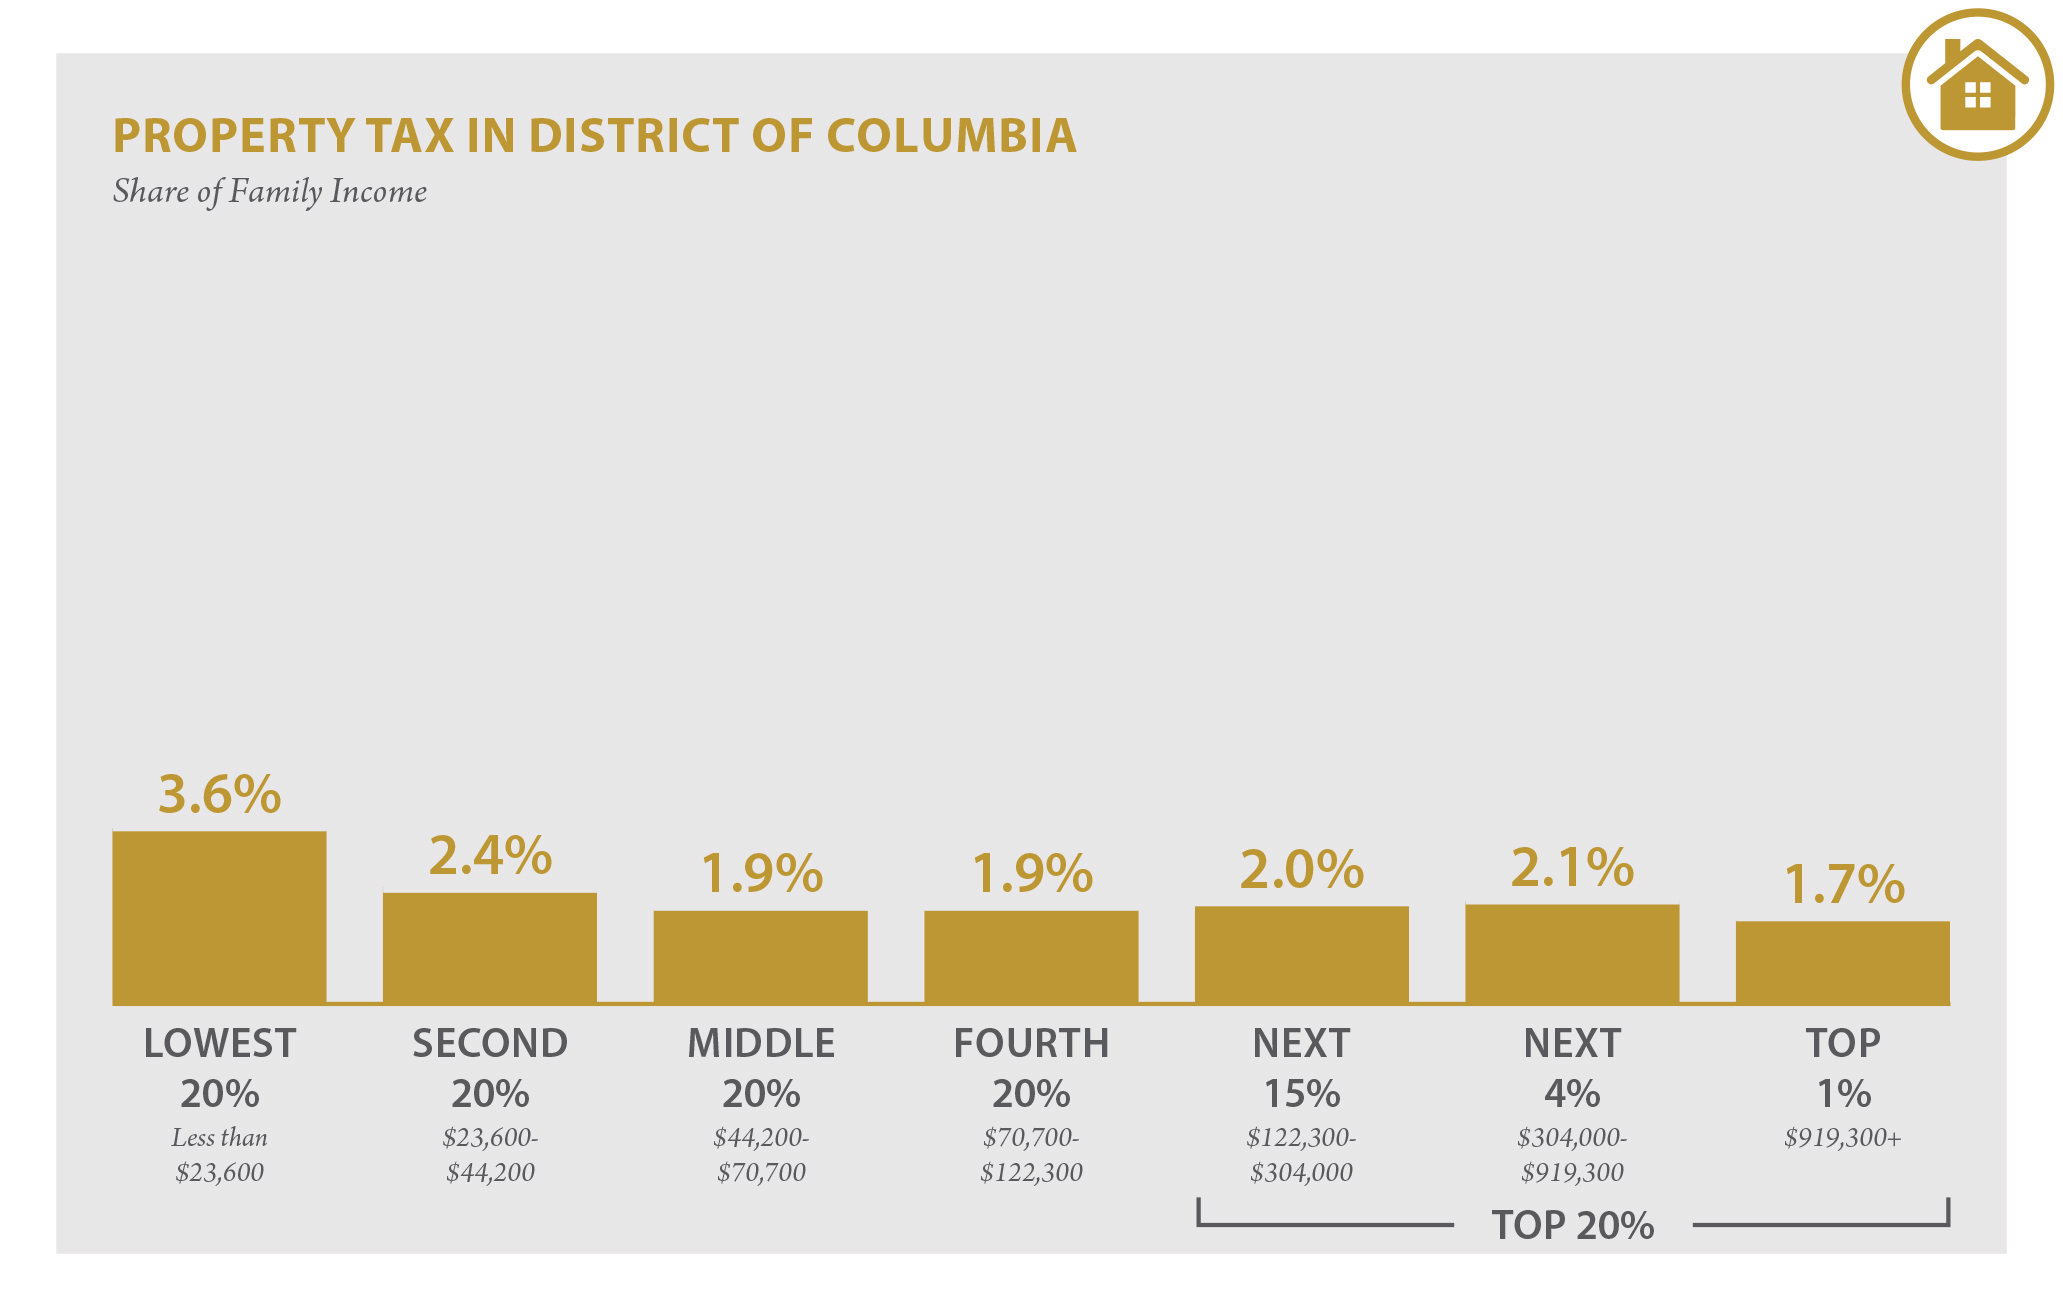
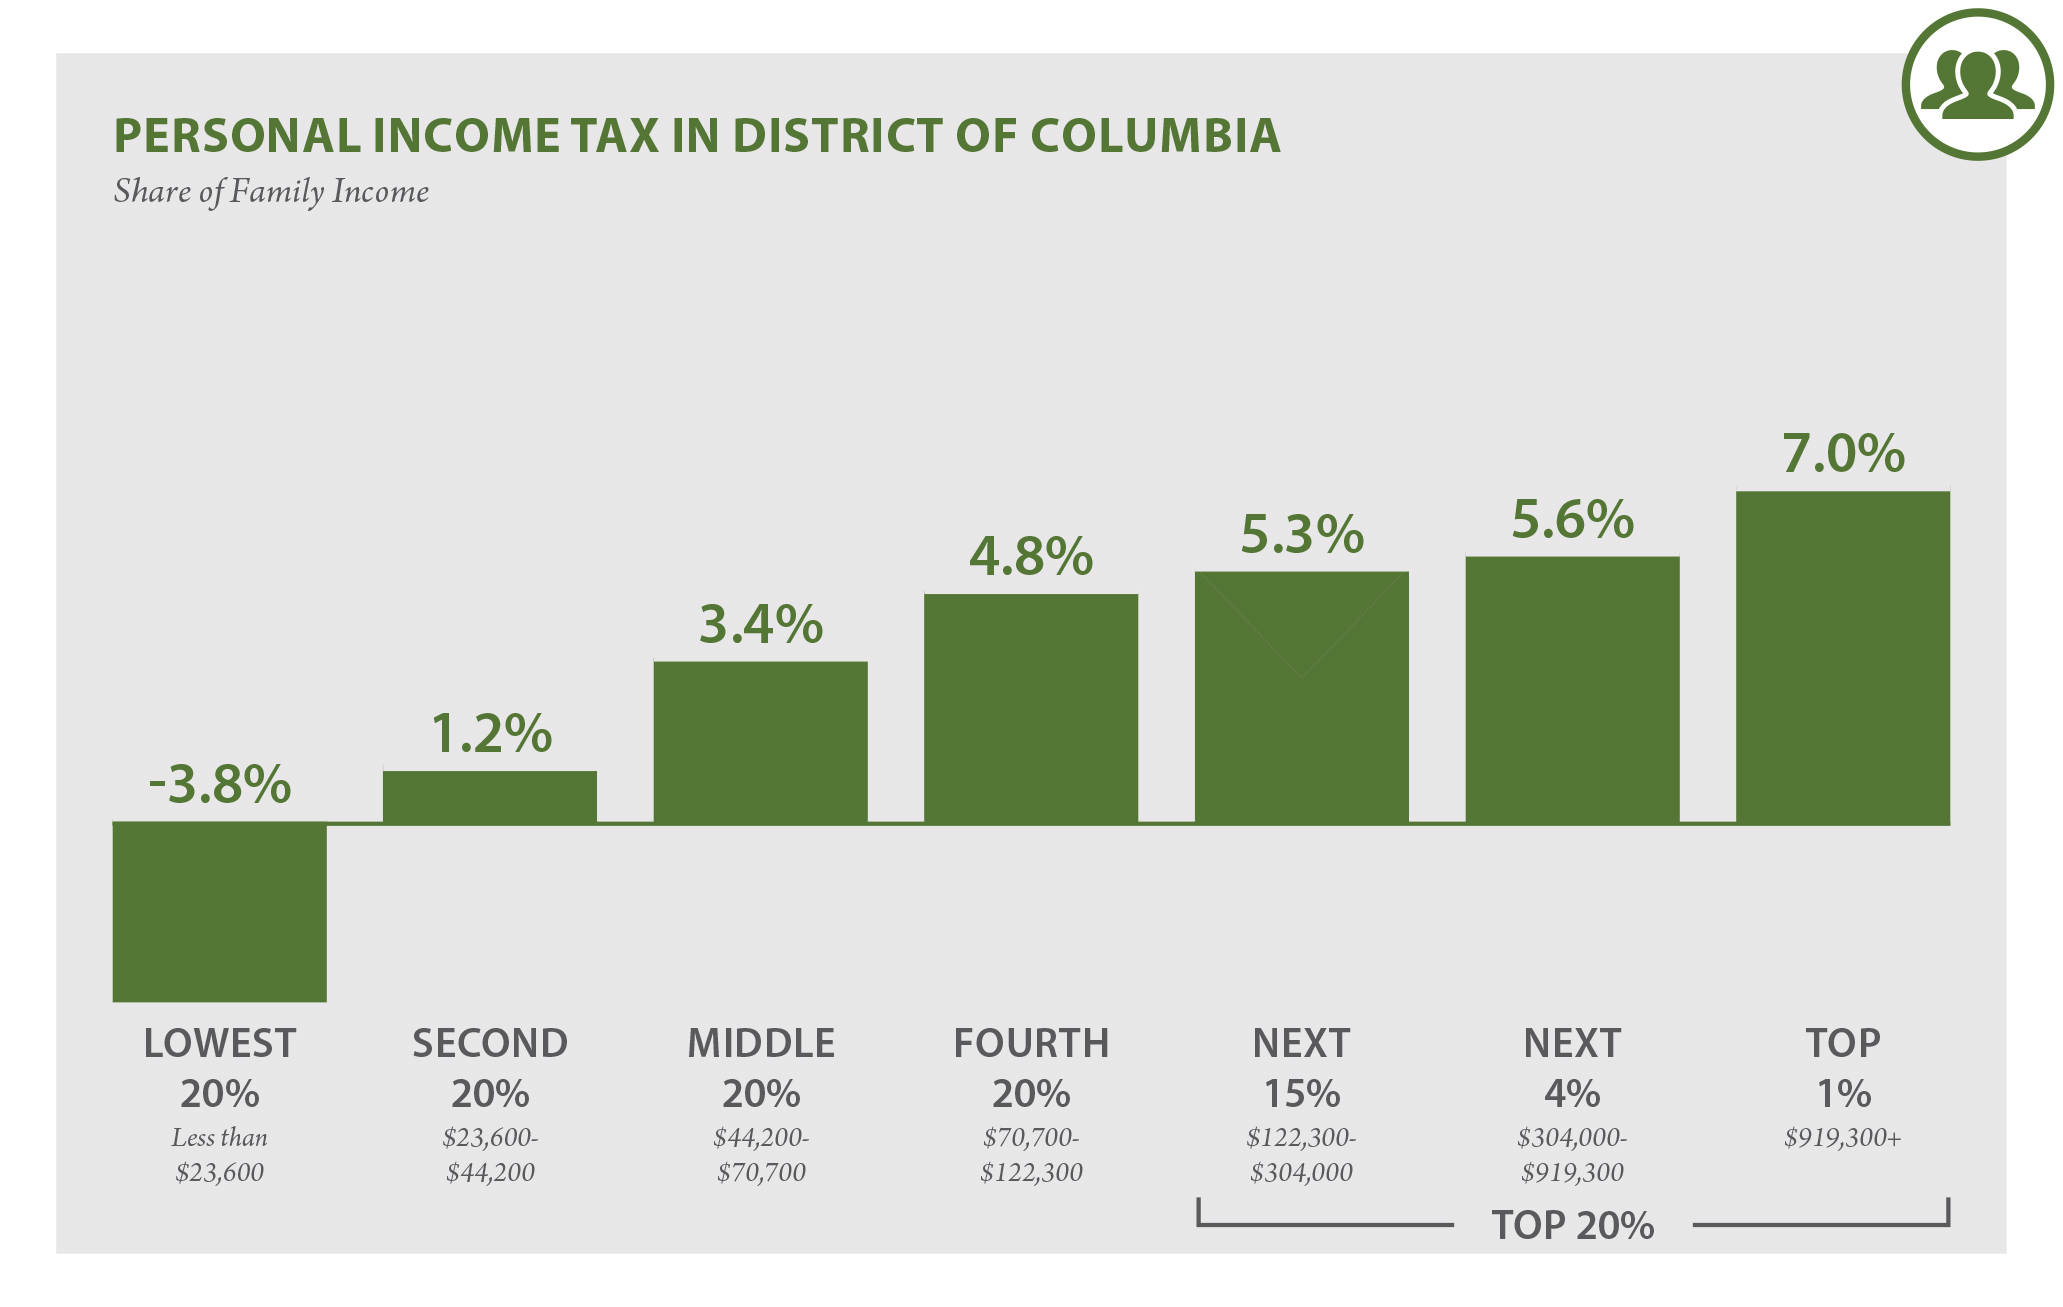
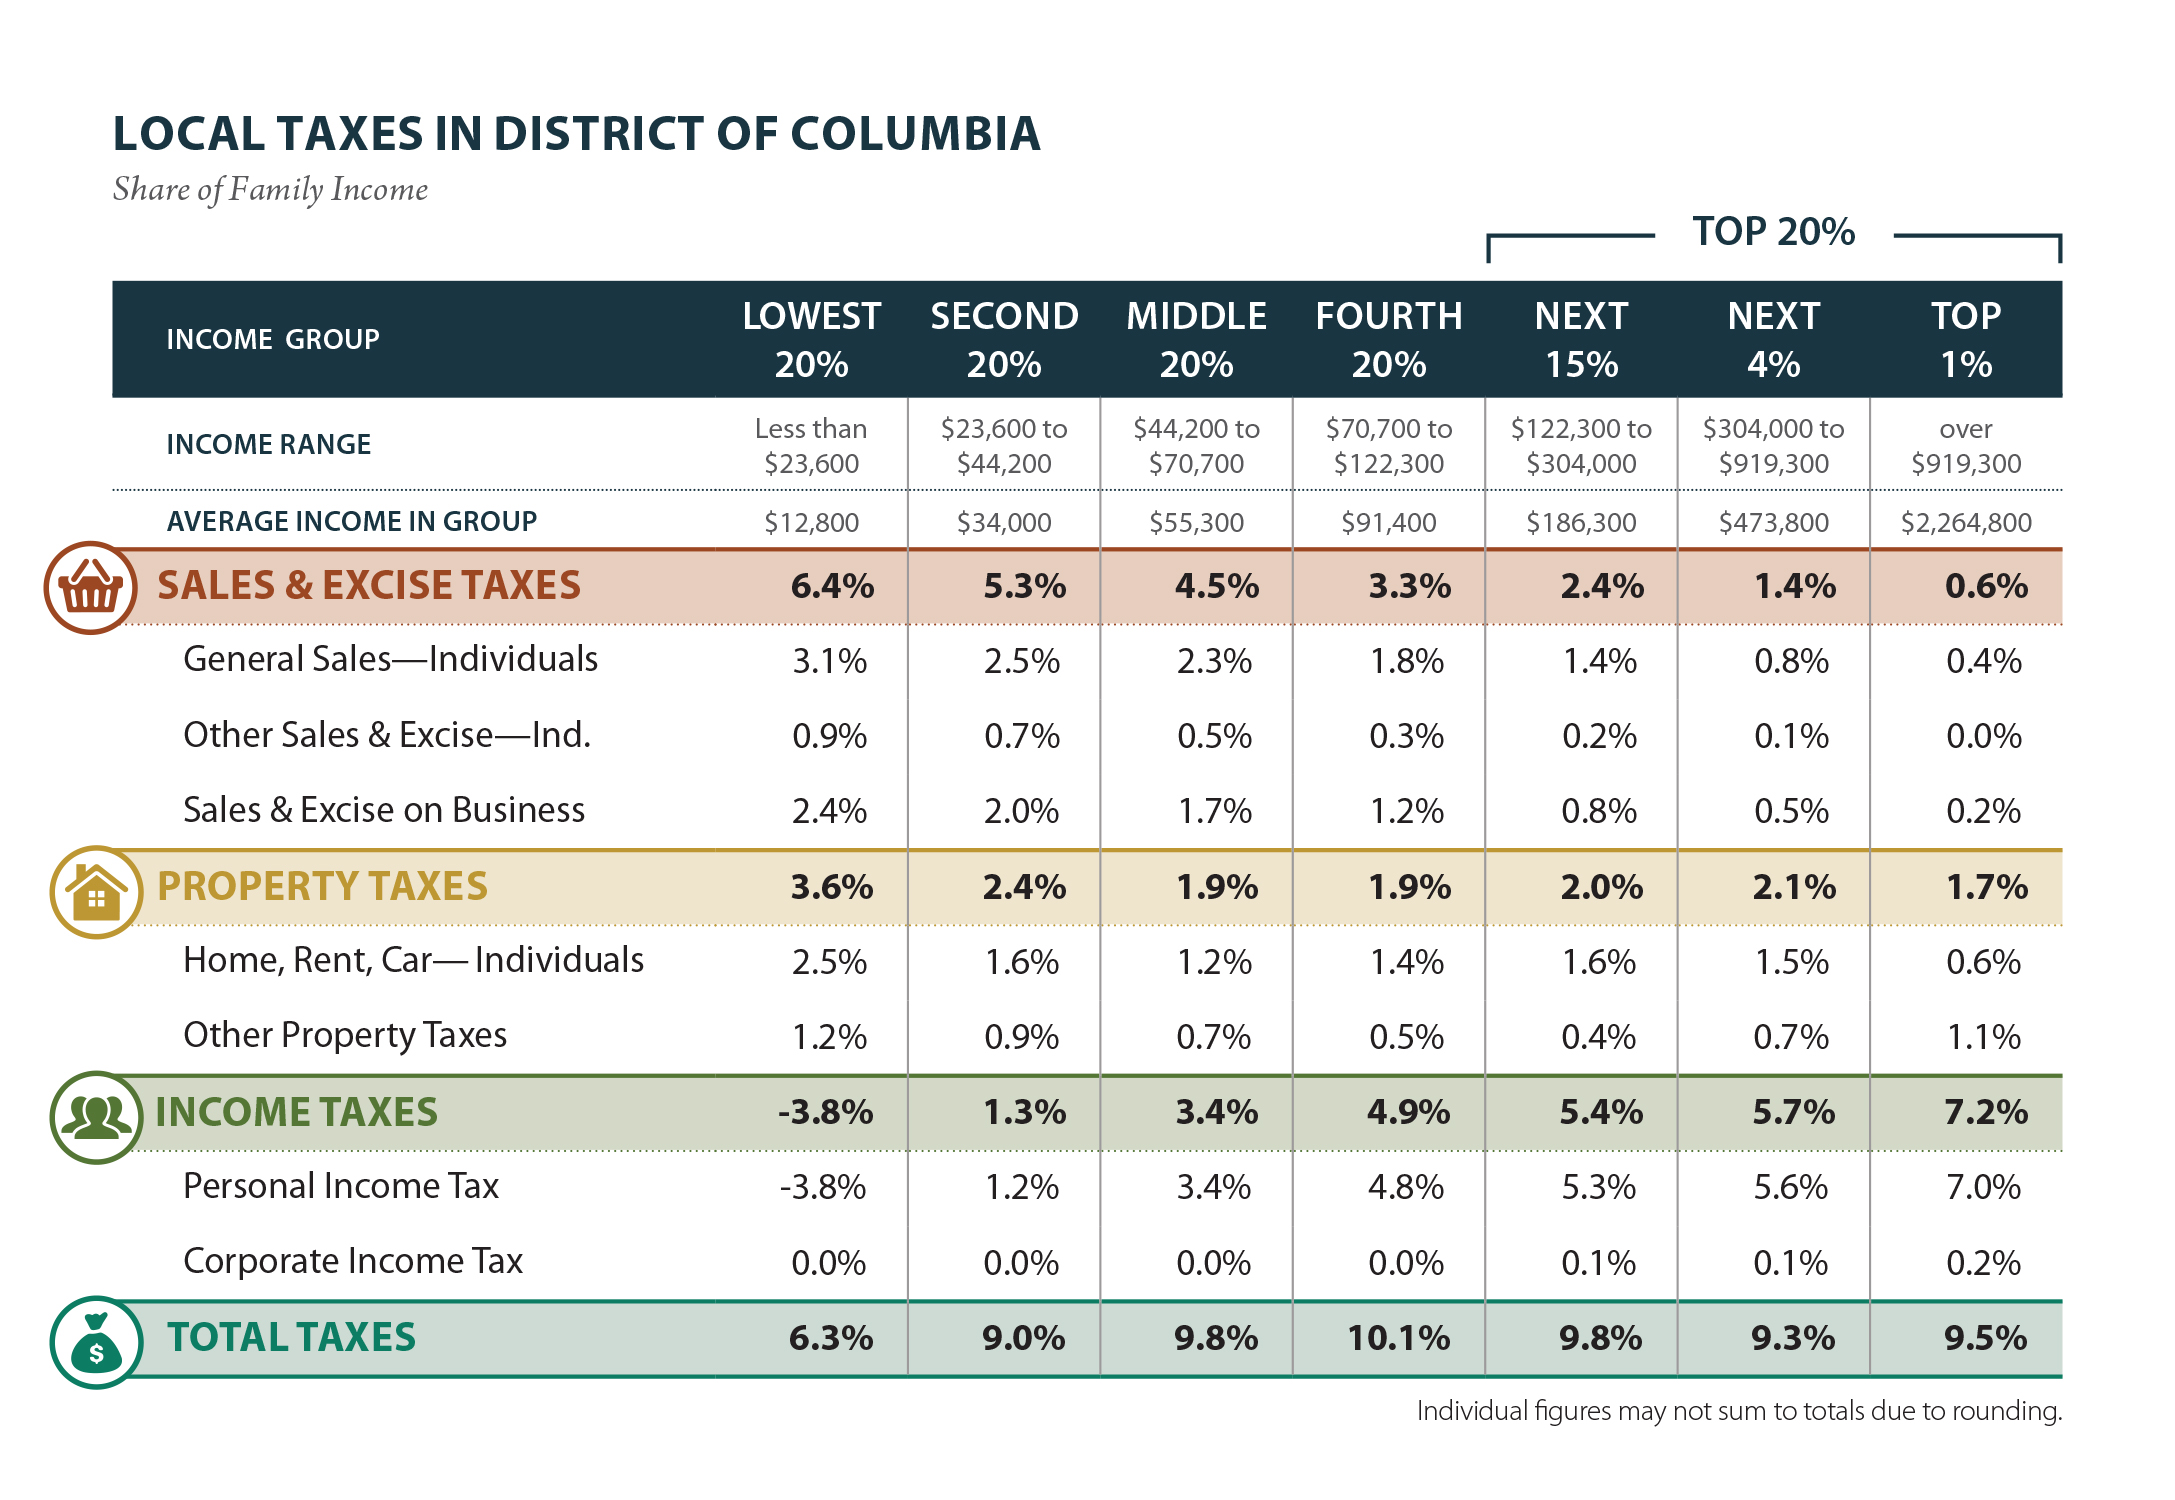
Taxes as Share of Family Income
| Top 20% | |||||||
|---|---|---|---|---|---|---|---|
| Income Group | Lowest 20% |
Second 20% |
Middle 20% |
Fourth 20% |
Next 15% |
Next 5% |
Top 1% |
| Income Range | Less than $23,600 |
$23,600 to $44,200 |
$44,200 to $70,700 |
$70,700 to $122,300 |
$122,300 to $304,000 |
$304,000 to $919,300 |
over $919,300 |
| Average Income | $12,800 | $34,000 | $55,300 | $91,400 | $186,300 | $473,800 | $2,264,800 |
| Sales & Excise Taxes | 6.4% | 5.3% | 4.5% | 3.3% | 2.4% | 1.4% | 0.6% |
| General Sales – Individuals | 3.1% | 2.5% | 2.3% | 1.8% | 1.4% | 0.8% | 0.4% |
| Other Sales & Excise – Ind. | 0.9% | 0.7% | 0.5% | 0.3% | 0.2% | 0.1% | 0.0% |
| Sales & Excise on Business | 2.4% | 2.0% | 1.7% | 1.2% | 0.8% | 0.5% | 0.2% |
| Property Taxes | 3.6% | 2.4% | 1.9% | 1.9% | 2.0% | 2.1% | 1.7% |
| Home, Rent, Car – Ind. | 2.5% | 1.6% | 1.2% | 1.4% | 1.6% | 1.5% | 0.6% |
| Other Property Taxes | 1.2% | 0.9% | 0.7% | 0.5% | 0.4% | 0.7% | 1.1% |
| Income Taxes | -3.8% | 1.3% | 3.4% | 4.9% | 5.4% | 5.7% | 7.2% |
| Personal Income Tax | -3.8% | 1.2% | 3.4% | 4.8% | 5.3% | 5.6% | 7.0% |
| Corporate Income Tax | 0.0% | 0.0% | 0.0% | 0.0% | 0.1% | 0.1% | 0.2% |
| TOTAL TAXES | 6.3% | 9.0% | 9.8% | 10.1% | 9.8% | 9.3% | 9.5% |
Individual figures may not sum to totals due to rounding. Download the table
TAX FEATURES DRIVING THE DATA in District of Columbia
 Progressive Features |
 Regressive Features |
|---|---|
|
|
ITEP Tax Inequality Index
According to ITEP’s Tax Inequality Index, the District of Columbia’s local tax system does not worsen income inequality and ranks 50th on the index. The large income gap between lower- and middle-income taxpayers, as compared to the wealthy, is somewhat narrower after state and local taxes than before. (See Appendix B for state-by-state rankings and the methodology for additional detail on the index.)
Note: Figures show permanent law in the District of Columbia enacted through September 10, 2018, at 2015 income levels. Top figure represents total District taxes as a share of non-elderly income. The sixth edition of Who Pays does not include the impact of the federal deduction for state and local taxes (SALT) because policy changes in the 2017 federal Tax Cuts and Jobs Act temporarily limited the extent to which the SALT deduction functions as a generalized offset of state and local taxes.


